Film Adhesion Strength Measurement Report
Objective:
The objective of this experiment is to perform a feasibility study of FSM Aquaflex 4 Point Bend (4PB) testing system for film adhesion strength measurement. The experiment was performed over 2 different types of samples having ~200A doped carbon film on SiO over Si substrate. The test result (found on a limited number of samples) shows that the adhesion strength of S15 samples is little higher compared to S16 samples.
Sample Description:
The sample descriptions were provided in the table below. Considering that this was a preliminary experiment, the sample selection from each wafer was done in random order. In the subsequent measurement request, a defined sample logging
Observation:
Two samples were measured from each set to check data consistency. A typical force versus displacement curve is shown in Figure 3 for the reference sample mentioned in Table-1. You can clearly see the “plateau” where the layer is coming away from the sample (Crack Propagation). This type of curve is like all of those measured on Samples 1 and 2, except Sample 2, Run 2. The G value from the plateau is listed below in Table
A typical force versus displacement curve is shown in Figure 1, there is no extended plateau. The load versus displacement curve for Sample 2, Run 2 is in a similar shape.
It is noticeable from the above table that there is some difference between the values for samples 1 and 2. The adhesion energy release rate of sample 2 (S-15) is higher than that of sample 1 (S-16). Therefore, we can say that S-15 has relatively higher adhesion strength between the layers of substrate and film than in S-16. The detailed data curves and analysis are in Appendix A.
Appendix A:Detailed Data and Analysis
Calculation: Calculate using variables (G, l, h1, h2, b, P, E & v) values
Figure1:Sample 1, Run 1
Figure2:Sample 1, Run 2
Figure3:Sample 1, Run 3
Figure4:Sample 2, Run 1
Figure5:Sample 2, Run 2
Figure6:Sample 2, Run 3
Basic Principal:
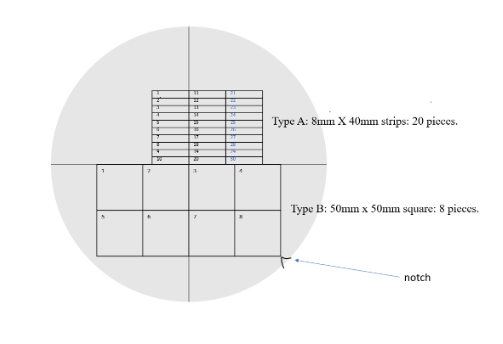
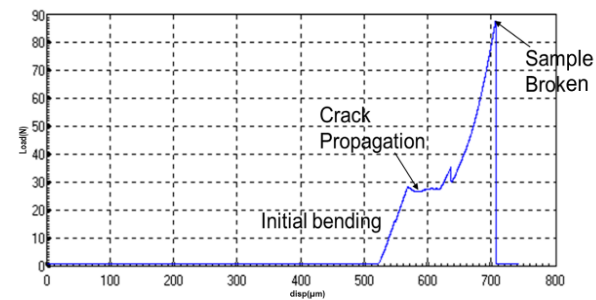
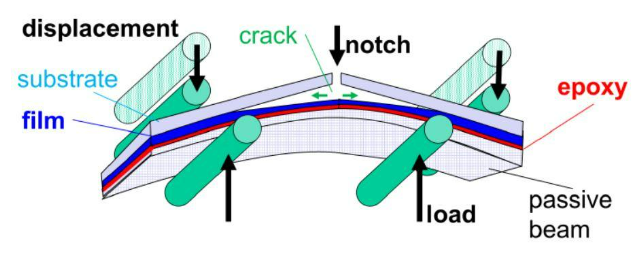
The 4-point bend configuration as illustrated in figure 5 is based on a sandwich structure. A sample consisting of multi-layer blanket thin film stacks deposited on a silicon substrate (split beam) is diced or cleaved from the wafer to be tested and bonded face to face to silicon backing (passive) such that the film stack is placed in the middle of the sandwich structure. To create the sandwich structure, the sample is bonded by means of epoxy. The sandwich structure is processed in the bonding tool and cured in a convection oven at a certain time and temperature, depends upon the characteristics of the epoxy bonding material used. Epoxy thickness and uniformity are very important to obtain repeatable results in the 4-point bend technique. The split beam is carefully notched to within a few microns of the sandwiched thin film structure with a medium or high-speed dicing saw. A special bending fixture (4-point bend) is used to test the sample. The load is measured by the load cell and the displacement is incremented using an actuator. A computer is used to control the actuator and record load and time simultaneously. As the bending moment increases, a pre-crack initiates from the top surface (facilitated by a machined notch) and propagates vertically to the interface. If the interface is sufficiently weak, the crack deflects into the interface and propagates along it. Sometimes, a particular constituent layer is weaker in cohesive strength than any of the interfaces, and the crack will propagate parallel to the interface within that layer, provided that such a mode I path exists. When the crack tip is sufficiently far away from the vertical pre-crack (a > 2h), the strain energy release rate becomes independent of the crack length, characteristic of steady-state crack growth. Applying beam theory, the strain energy release rate is related to measurable quantities.