Measurement Report 1
Objective: Measuring Wafer Bow as a Function of Temperature
The objective of this sample measurement is to determine the change in bow height across the diameter of three 300mm wafers as a function of temperature using the FSM 500TC Metrology System.


Customer Instructions
2. step #1: Measure bow height at RT (room temperature)
step #2: Changing temp at 200ºC, 400ºC, 500ºC, 400ºC, 200ºC, & RT
step #3: At 400ºC (both heating and cooling), wait for 10min to stabilize wafer temp and measure wafer bow again at 400ºC

Result Analysis


Summary:
FSM 500TC determined the bow height successfully as a function of the temperature of the customer’s wafers and provided the following valuable information:
1. The bow heights for all the five wafer slots have been measured for the following temperature cycle: RT, 200ºC, 400ºC, 400ºC (after 10 min), 500ºC, 400ºC, 400ºC (after 10 min), 200ºC, RT.
2.When the temperatures are gradually heated up from RT, the positive bow heights of wafer 5 and 18 sharply decrease until the temperature of the wafer chamber reaches around 500ºC. In case of wafer 6, the negative bow heights sharply increase until the temperature of the wafer chamber reaches around 500ºC.
3.However, the bow height characteristics behaved quite differently for wafer 6 compared to wafer 5 and 18. During the cooling cycle, the bow height at room temperature crosses the bow height at 500ºC which looks very unwieldy. Actually, once the temperature rises to 500ºC then the bow height increases although the temperature is decreasing. In other words, after reaching 500ºC, the bow height begins to increase, even though the temperature is falling.
Measurement Report 2
Objective: Stress, Bow Measurement respect with Temparature
The objective of this wafer/sample measurement report is to determine the change in bow height, the reflectivity of Glass and TDS across the diameter of four wafers as a function of temperature and time using the FSM 900TC Metrology system.
Customer Instructions & Result Analysis
2. Do measurement at both heating and cooling cycles.
3. Try to find a way to force cool down, especially for 100C and below (which generally takes longer).
4. Measure only at one angle.


Conclusion:
For each temperature unit, the bow height of the cooling cycle is greater than that of the heating cycle. The demonstration of the changes in the bow height of sample 1(W#183) for both the heating and cooling cycles are shown in Figure 2 as a function of temperature and time, respectively.
For RT to 900C (Heating Cycle):The wafer bow height shows a flat increase less than 9 um when the temperature was less than 4000C. After 4000C, the bow height abruptly decreases until the temperature reaches to 5070C and after 5070C, the bow height gradually increases as temperature increases up to 9000C.
For 900C to RT (Cooling Cycle):The change in bow height during the cooling cycle exhibits the opposite behavior when compared to the change in bow height during the heating cycle. The wafer bow height sharply decreases from 9000C to 6650C. Below 6650C, the bow height gradually increases until the temperature decreases up to 5030C. Below 5030C, a decline in the bow height is observed until 300C RT. However, the measurement shows a sudden upshift in the bow height from 2420C to 2220C.
Measurement Report 3
Objective: Thermal Desorption Spectroscopy (TDS) Measurement
The objective of this wafer/sample measurement report is to determine the change in bow height, the reflectivity of Glass and TDS across the diameter of four wafers as a function of temperature and time using the FSM 900TC Metrology system.
Customer Instructions & Result Analysis
2. Decrease temperature from 200C to RT
3. Again, increase temperature from RT to 200C
4. Then decrease temperature from 200C to RT
5. Measure the partial pressure of individual outgassed species from RT to 2000C

Summary:
First heating cycle:The partial pressures for the outgassing elements are measured using Thermal Desorption Spectroscopy (TDS). We have identified following findings from the first heating cycle:
Water (H2O-18 AMU) was found to be the major outgassing species at the beginning of the temperature ramp (330C to 560C).
From 560C to 2000C, N2 exhibited larger partial pressure than that of other outgassing elements.
Second heating cycle: The partial pressures for the outgassing elements are measured using Thermal Desorption Spectroscopy (TDS). We have identified following findings from the second heating cycle:
(i) N2 (28 AMU) was found to be the major outgassing species during the whole heating period.
(ii) From RT to 2000C, CO2 exhibited lowest partial pressure than that of other outgassing elements.


Measurement Report 4:
Objective: Stress Hysteresis and Stress Gradient for CTE calculation
The objective: Measure stress, stress hysteresis of 300mm wafers described in Table 1 using the FSM 900TC system. Each wafer is to be measured multiple times.
Wafer Description
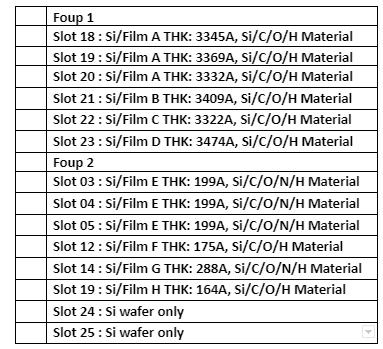
Bare Wafers on slot 24 and 25 were used for stress calculation. Note, not using the same substrate in pre and post deposition measurement causes a systematic error in stress calculation.
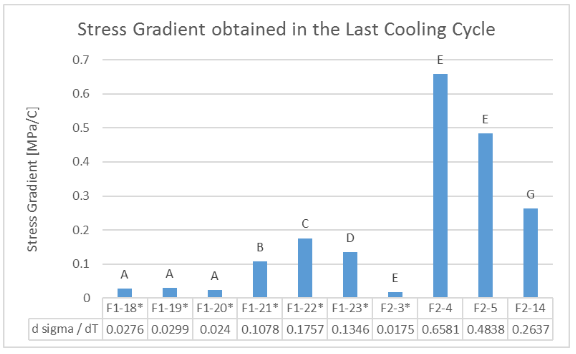
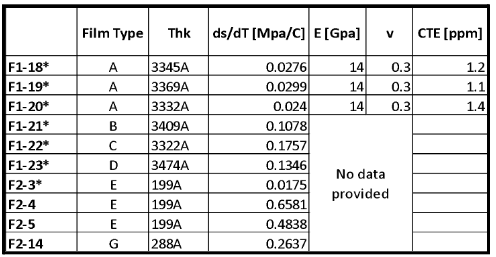
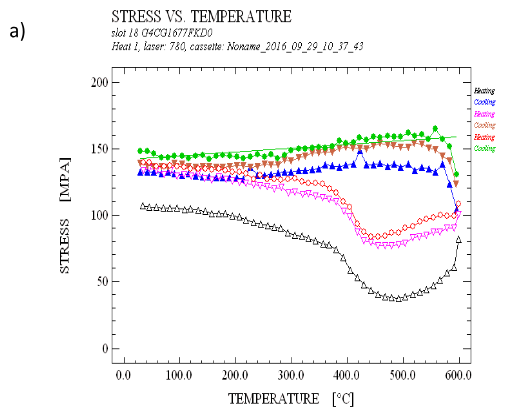
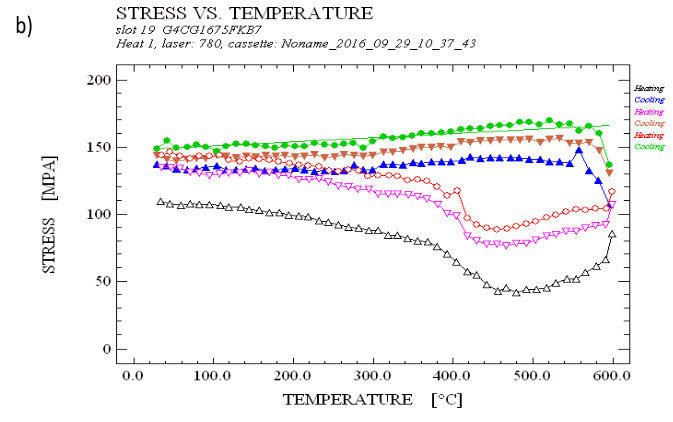
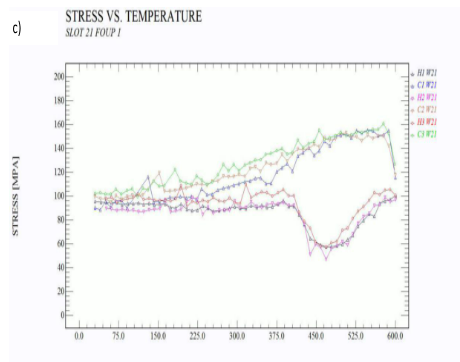
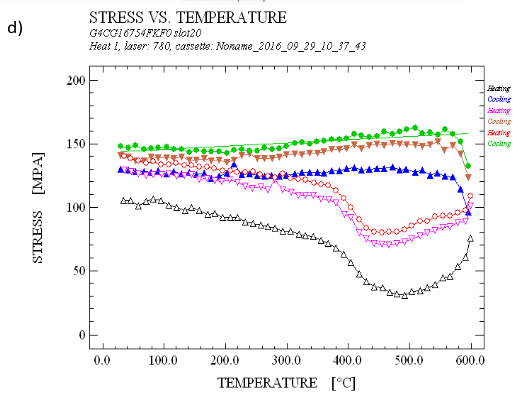
Repeatability Tests:Per DRF (Appendix A) repeatability tests are to be performed on Foup 1 slots 18-20 and Foup 2 slots 03-05 by measuring each sample for 3 days. The results show that the films are not perfectly thermally stable; we observe stress hysteresis (see section B1) and decreasing TDS from run to run. Therefore, we analyze CTE and TDS repeatability by looking at the variation between the three wafers of same film type in each FOUP.
Distinguishing Capability: If the CTE and TDS data values obtained for films B, C, D and F, G, H are outside the range of film A obtained in slots 18-20 and outside the range of film E obtained in slots 3-5, one can conclude that the tool can distinguish the different films.
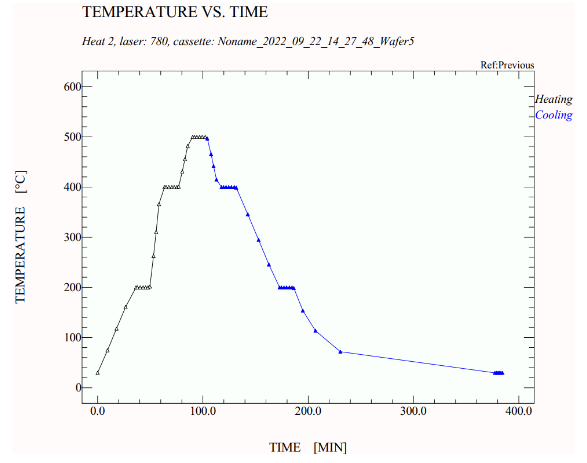
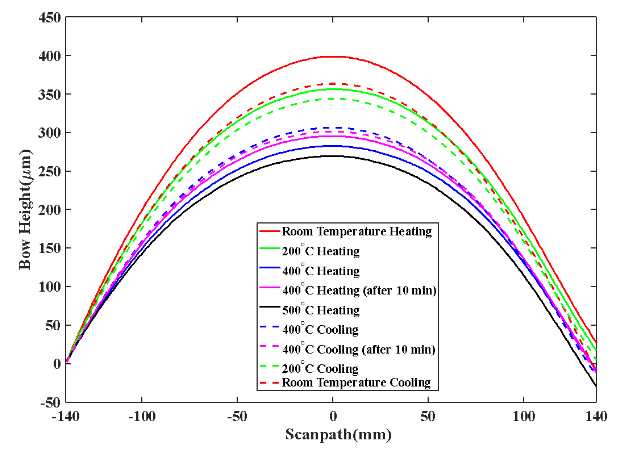
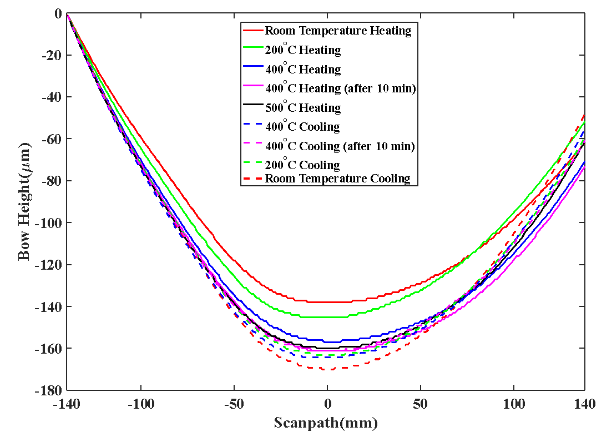
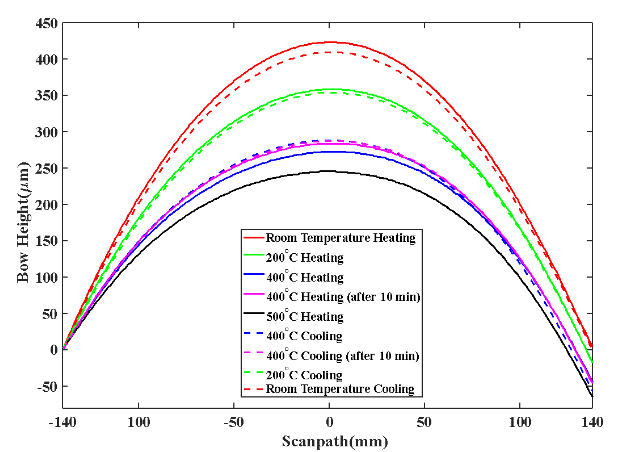
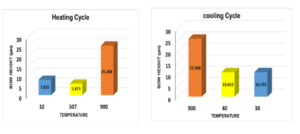
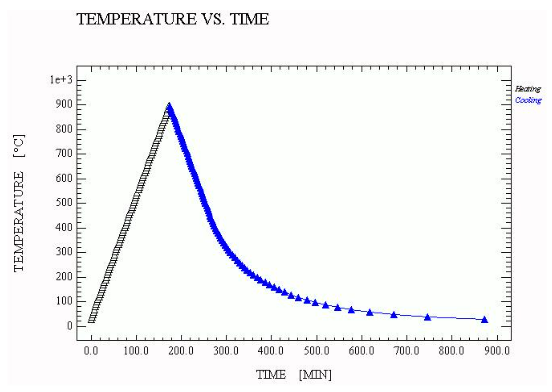
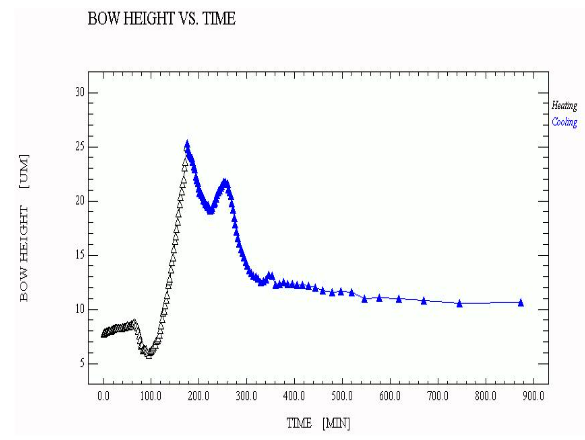
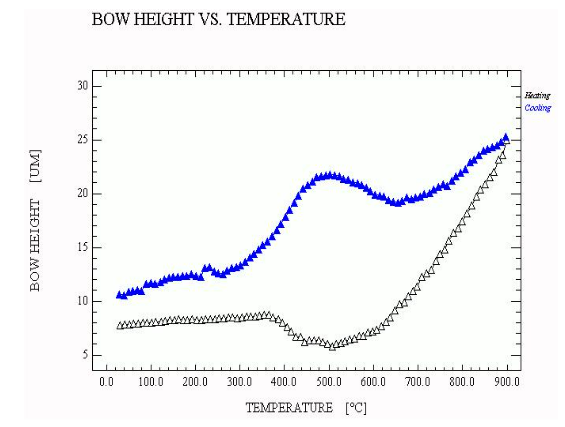
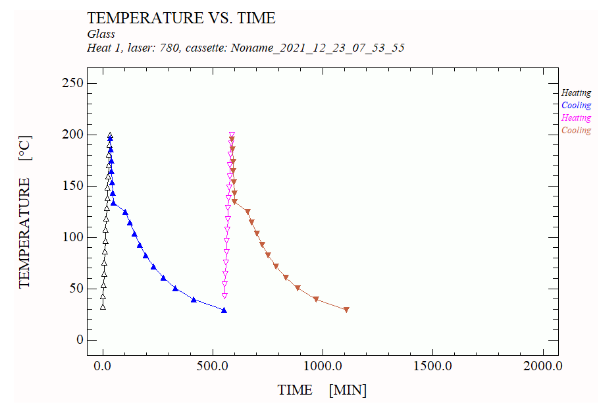
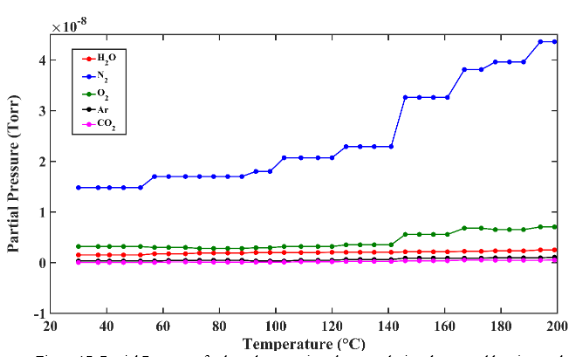
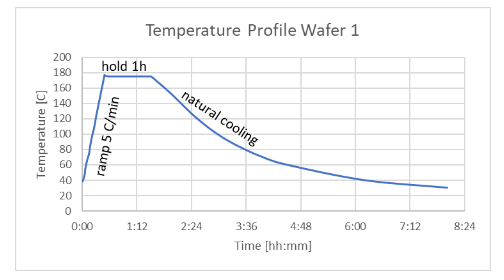
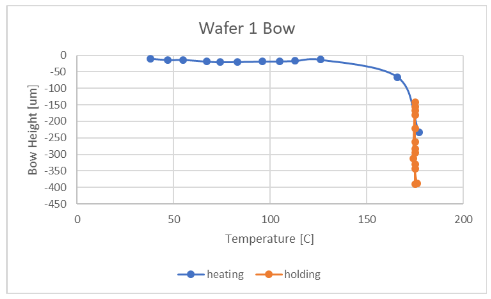
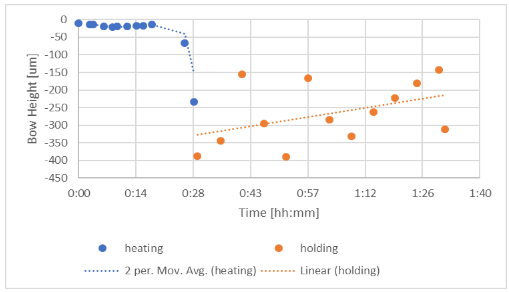
5. Measure change in war page with respect to time and temperature.

Summary: Stress Hysteresis and Stress Gradient for CTE calculation
Stress Gradient: As explained in section F, the stress gradients are related to the film’s CTE. Figure 1 and Table 2 show the stress gradients obtained in the last cooling cycle between room temperature and 600C or 900C (* denotes max. temperature 600C). For the thick films in Foup 1 (F1) we see very similar gradients for the three wafers with film A and noticeably different gradients for films B, C, and D. For the thinner films in Foup 2 (F2) a large variation in stress gradients is observed. While wafers on slot 4 and 5 (F2-4, F2-5) show stress gradients of same magnitude, the wafer on slot 3 (F2-3) shows a much smaller gradient. A possible reason is that slots 4 and 5 have been annealed up to 900C, while slot 3 was only heated up to 600C. From the stress gradient the CTE can be derived, if the mechanical properties of the film and substrate are known (see section F). For film type A, TSMC had provided Young’s modulus E=14 and Poisson ratio v=0.3. This allows us to calculate the CTE to be 1.2 +/-0.2 ppm for film A after 3 heating cycles to 600C.
1.Figure: Gradients obtained in the last cooling cycle between room temperature and 600C 900C (* denotes max. temperature 600C).
2.Table: Gradients obtained in the last cooling cycle between room temperature and 600C or 900C (* denotes max. temperature 600C)


Stress Hysteresis: The stress vs. temperature plots for 3 heating and cooling cycles for the wafers in Foup 1 and Foup 2, respectively.
Slot 18, 19, 20 in FOUP 1 with film type A show very similar stress hysteresis behavior. In the first heating cycle the stress gradually decreases to about 400C, then strongly decreases further to about 500C and then rises sharply going to 600C. The subsequent cooling cycle is relatively flat resulting in an overall stress change of about 30MPa at room temperature. The graphs of heating cycles 2 and 3 show similar shape as heating cycle 1, but the stress increase at 600C is less resulting in only small further stress change at room temperature.
Slot 21 with film B’s behavior is different: All heating and cooling cycles are very similar to each other respectively and only a small stress change at room temperature can be seen after 3 cycles. The stress change during heating up to 375C is relatively flat, followed by a decrease and a strong increase above 460C. A significant stress change with temperature is observed in the cooling cycles.
Slot 22 and 23, film C and D, respectively are qualitatively similar to each other and differ from slots 18, 19, 20 in the following ways: After each heating and cooling cycle there is noticeable stress change at room temperature. There is an increase in stress around 375C.
Here Stress hysteresis for samples (a) slot 18, (b) 19, (c) 20, (d) 21, (e) 22, (f) 23 in FOUP 1.


Measurement Report 5
Bow and TDS Measurement
The objective of this demo measurement is to determine outgassing species and change in bow height of three 300mm wafer samples with black mold as a function of temperature and time using the FSM 900TC-Vac – Multi-Probe Vacuum Integrated Metrology System, a powerful materials characterization system by Frontier Semiconductor (FSM).
The particular objective for Samples 1 and 2 described in the table below is to determine what outgassing species are present during ramp-up and post-mold cure conditions of panel (175C). For sample 3 the objective is to determine what outgassing species are present during pre-seed bake conditions of panel (224C), and to determine if under these conditions moisture is completely removed from the panels.
Customer’s Instructions
1. Ramp vacuum pressure from 760mTorr to base vacuum.
2. Ramp temperature from RT to 175C at 5C/min.
3. Measure outgassed species from RT to 175C. Plot outgassed species with respect to temp/time. (see Figure 5 and Figure 7)
4. Hold at 175C and measure outgassed species from T0 to 1 hr. Plot outgassed species with respect to time. (see Figure 6 and Figure 8)
5. Measure change in warpage with respect to time and temperature.

Result Analysis


Equipment: FSM 900TC-Vac
Frontier Semiconductor’s FSM 900TC-VAC Multi-Probe Vacuum Integrated Metrology System is a unique integrated metrology system to measure film stress and wafer bow height during thermal annealing and cooling cycles. It features a vacuum heating chamber. Heating and cooling can be done in vacuum to prevent oxidation or in gas environment to mimic process conditions. Besides bow height and stress measurement it can be configured with additional probes to provide:

